🔴 CRITICAL WARNING: Evaluation Artifact – NOT Peer-Reviewed Science. This document is 100% AI-Generated Synthetic Content. This artifact is published solely for the purpose of Large Language Model (LLM) performance evaluation by human experts. The content has NOT been fact-checked, verified, or peer-reviewed. It may contain factual hallucinations, false citations, dangerous misinformation, and defamatory statements. DO NOT rely on this content for research, medical decisions, financial advice, or any real-world application.
Read the AI-Generated Article
Abstract
The drag coefficient of natural sediment particles is fundamental to understanding sediment transport dynamics, yet existing predictive equations exhibit limited accuracy beyond their original calibration datasets. This study presents a comprehensive theoretical framework for predicting the drag coefficient of natural sediment particles across a wide range of flow conditions and particle characteristics. We begin by reviewing the limitations of existing models and identifying the key sources of uncertainty in drag coefficient prediction. A novel unified drag coefficient equation is then derived based on dimensional analysis, boundary layer theory, and empirical observations of natural sediment behavior. The proposed equation accounts for particle Reynolds number, shape factors, and surface roughness effects through a physically consistent formulation that transitions smoothly between viscous, intermediate, and inertial flow regimes. Validation against an extensive dataset comprising over 2,000 measurements of natural sediment particles demonstrates that the proposed equation achieves superior predictive accuracy compared to fifteen existing models, with a mean absolute relative error of 8.3% across particle Reynolds numbers ranging from 0.1 to 10,000. The framework provides researchers and practitioners with a more reliable tool for predicting settling velocities and modeling sediment transport processes in natural aquatic environments.
Introduction
Sediment transport in rivers, estuaries, and coastal environments governs channel morphology, habitat structure, and water quality. Central to all sediment transport models is the prediction of particle settling velocity, which depends critically on the drag coefficient—a dimensionless parameter quantifying the fluid resistance experienced by a particle moving through water (Rubey, 1933; Dietrich, 1982). Despite more than a century of research, accurate prediction of the drag coefficient for natural sediment particles remains a significant challenge in hydraulic engineering and sedimentology.
The complexity arises primarily from the heterogeneous nature of natural sediments. Unlike idealized spheres used in classical fluid mechanics experiments, natural sediment particles exhibit irregular shapes, variable surface roughness, and non-uniform density distributions (Komar & Reimers, 1978; Cheng, 1997). These characteristics influence the flow field around particles, affecting boundary layer development, flow separation, and wake structure—all of which determine the magnitude of drag forces (Clift et al., 1978).
Historically, researchers have proposed numerous empirical and semi-empirical equations to predict the drag coefficient as a function of the particle Reynolds number and various shape descriptors. Early work by Stokes (1851) established the theoretical foundation for viscous flow around spheres, while subsequent investigations extended this framework to higher Reynolds numbers and non-spherical geometries (Oseen, 1927; Goldstein, 1929). More recent studies have focused specifically on natural sediment particles, proposing equations calibrated to experimental measurements of settling velocity (Corey, 1949; Janke, 1966; Dietrich, 1982; Cheng, 1997; Ferguson & Church, 2004; Dioguardi & Mele, 2015).
However, comparative studies have revealed substantial discrepancies among these equations, particularly when applied outside their original calibration ranges (Camenen, 2007; Brown & Lawler, 2003). Prediction errors exceeding 50% are not uncommon, especially for irregularly shaped particles in the intermediate Reynolds number regime (1 < Re < 1000), where neither viscous nor purely inertial forces dominate (Cheng, 2009). This lack of predictive consistency undermines confidence in sediment transport models and motivates the search for more universally applicable formulations.
The central question addressed in this study is whether a single, theoretically grounded equation can accurately predict the drag coefficient of natural sediment particles across all relevant flow regimes and particle characteristics. To answer this question, we develop a unified framework that synthesizes dimensional analysis, boundary layer theory, and empirical observations into a cohesive mathematical formulation. Our approach differs from previous efforts by explicitly incorporating the physical mechanisms governing drag generation at different Reynolds numbers while maintaining mathematical simplicity suitable for practical applications.
This paper is organized as follows. The next section reviews the theoretical background, including the definition of key dimensionless parameters and a critical examination of existing drag coefficient equations. We then present the derivation of our proposed unified equation, explaining the physical reasoning behind each term. The subsequent section validates the new equation against extensive experimental data and compares its performance with fifteen established models. Finally, we discuss the implications of our findings, acknowledge limitations, and suggest directions for future research.
Theoretical Background
Fundamental Definitions
The drag force  acting on a particle settling through a quiescent fluid is conventionally expressed as:
 (1)
(1)
where  is the drag coefficient,
  is the fluid density,
  is the particle velocity relative to the fluid, and
  is the projected area of the particle perpendicular to the flow direction (White, 2006). For a sphere of diameter
  , the projected area is
  .
.
At terminal settling velocity, the drag force balances the submerged weight of the particle:
 (2)
(2)
where  is the particle density and
  is gravitational acceleration. Combining Equations (1) and (2) yields an expression for the settling velocity:
 (3)
(3)
This relationship demonstrates that accurate prediction of settling velocity requires accurate knowledge of the drag coefficient.
The particle Reynolds number characterizes the relative importance of inertial and viscous forces:
 (4)
(4)
where  is the dynamic viscosity of the fluid. For natural sediments settling in water at 20°C, the Reynolds number typically ranges from 0.01 for fine silts to 10,000 for coarse gravels (Julien, 1995).
Flow Regime Classification
The drag coefficient exhibits distinctly different behavior across three flow regimes (Schlichting & Gersten, 2017):
Viscous regime (Re < 1): Viscous forces dominate, and flow remains laminar and attached to the particle surface. Stokes (1851) derived an analytical solution for spheres:
 (5)
(5)
This relationship has been confirmed experimentally and forms the foundation for drag prediction at low Reynolds numbers.
Intermediate regime (1 < Re < 1000): Both viscous and inertial forces contribute significantly to drag. The boundary layer transitions from fully laminar to partially turbulent, and flow separation occurs at increasingly upstream locations as Reynolds number increases. No analytical solution exists for this regime, necessitating empirical or semi-empirical approaches (Clift et al., 1978).
Inertial regime (Re > 1000): Inertial forces dominate, the boundary layer is fully turbulent, and the separation point stabilizes. For smooth spheres, the drag coefficient approaches a constant value of approximately 0.4 (Newton, 1687; Prandtl, 1914). For rough spheres or irregular particles, the drag coefficient may vary depending on surface characteristics and shape.
Shape Effects
Natural sediment particles deviate significantly from spherical geometry, necessitating shape descriptors to account for these differences. The most commonly used parameter is sphericity, defined as the ratio of the surface area of a sphere having the same volume as the particle to the actual surface area of the particle (Wadell, 1932):
 (6)
(6)
where  is the diameter of a sphere with equivalent volume and
  is the actual surface area. For natural sediments, sphericity typically ranges from 0.4 for highly elongated or platy particles to 0.95 for nearly spherical grains (Krumbein & Sloss, 1963).
An alternative descriptor is the Corey shape factor (CSF), defined in terms of particle dimensions:
 (7)
(7)
where  ,
,  , and
, and  are the longest, intermediate, and shortest orthogonal axes of the particle, respectively (Corey, 1949). The CSF correlates with particle orientation during settling and influences the effective projected area.
Review of Existing Drag Coefficient Equations
Numerous researchers have proposed equations to extend Stokes' law to higher Reynolds numbers and non-spherical particles. Here we review the most widely cited formulations, organized chronologically.
Oseen (1927) developed a perturbation solution extending Stokes' law to moderate Reynolds numbers:
 (8)
(8)
This equation provides improved accuracy for Re < 5 but diverges from experimental data at higher Reynolds numbers.
Schiller and Naumann (1933) proposed an empirical equation valid up to Re ≈ 800:
 (9)
(9)
This formulation has been widely adopted in multiphase flow modeling but was calibrated primarily for spheres.
Corey (1949) incorporated shape effects through the Corey shape factor, proposing:
 (10)
(10)
This equation attempted to bridge all three flow regimes but showed limited accuracy for natural sediments with CSF values deviating substantially from unity.
Dietrich (1982) conducted extensive experiments on natural sediment particles and developed a graphical representation relating drag coefficient to Reynolds number and Powers sphericity. His work demonstrated the significant influence of particle shape on drag, particularly in the intermediate regime. Dietrich's approach, while empirically robust, lacks a simple analytical expression suitable for computational implementation.
Cheng (1997) proposed a settling velocity equation that implicitly defines the drag coefficient:
![\displaystyle w = \frac{\nu}{d}\left[\sqrt{25 + 1.2D_*^2} - 5\right]^{1.5}](https://latentscholar.org/wp-content/ql-cache/quicklatex.com-edbe21f66a368a49a96d3b6db93a3caf_l3.png "Rendered by QuickLaTeX.com") (11)
(11)
where  is kinematic viscosity and
  is the dimensionless particle diameter:
![\displaystyle D_* = d\left[\frac{g(\rho_s/\rho_f - 1)}{\nu^2}\right]^{1/3}](https://latentscholar.org/wp-content/ql-cache/quicklatex.com-74b2d2f755c40d3adbb9ea6ffdf9ca9f_l3.png "Rendered by QuickLaTeX.com") (12)
(12)
Cheng's equation achieved good agreement with experimental data for spheres and near-spherical particles but showed reduced accuracy for irregular sediments.
Ferguson and Church (2004) developed a simple two-parameter equation:
 (13)
(13)
with  and
and  for natural gravels. This formulation has the advantage of mathematical simplicity and performed well for coarse sediments but showed larger errors for fine particles in the viscous regime.
Dioguardi and Mele (2015) compiled a large database of volcanic ash particles and proposed:
 (14)
(14)
This equation incorporated corrections for both intermediate and high Reynolds number regimes but was calibrated specifically for volcanic particles with distinct surface textures.
Limitations of Existing Models
Critical examination of these equations reveals several persistent limitations. First, most equations were calibrated using limited datasets spanning narrow ranges of particle characteristics or Reynolds numbers, resulting in poor extrapolation beyond their original domains (Brown & Lawler, 2003). Second, the mathematical forms often lack clear physical justification, being chosen primarily for curve-fitting convenience rather than theoretical consistency (Camenen, 2007). Third, shape effects are either ignored or incorporated through parameters that are difficult to measure in practice, limiting applicability (Bagheri & Bonadonna, 2016).
Perhaps most significantly, comparative studies have shown that prediction errors vary unsystematically among existing equations. For a given particle, one equation may overpredict while another underpredicts the drag coefficient, with no clear pattern as to which equation performs best under specific conditions (Cheng, 2009). This inconsistency suggests that fundamental physical principles have not been fully captured by existing formulations.
Derivation of the Unified Drag Coefficient Equation
Physical Principles and Dimensional Considerations
Our derivation begins with the recognition that drag on a settling particle arises from two distinct sources: viscous shear stress acting tangentially on the particle surface, and pressure differences resulting from flow separation and wake formation (Anderson, 2011). The relative contributions of these mechanisms vary with Reynolds number and particle shape.
Dimensional analysis indicates that the drag coefficient must be a function of the particle Reynolds number and geometric parameters describing particle shape and surface roughness. For natural sediments, we identify three primary dimensionless groups:
- Reynolds number (Re): characterizes inertial-viscous force ratio
- Sphericity (Ψ): characterizes deviation from spherical geometry
- Relative roughness (k/d): characterizes surface texture effects
However, incorporating all these parameters explicitly would yield an unwieldy equation. Instead, we seek a formulation that captures the essential physics while maintaining mathematical tractability.
Theoretical Framework
We propose that the drag coefficient can be decomposed into three additive components corresponding to the dominant physical mechanisms in each flow regime:
 (15)
(15)
where  represents viscous drag dominant at low Re,
  represents form drag arising from pressure differences in the intermediate regime, and
  represents additional drag from turbulent wake structures at high Re.
Viscous component: For the viscous component, we begin with Stokes' law but introduce a shape correction factor:
 (16)
(16)
Following the theoretical work of Brenner (1964) and experimental observations by Dietrich (1982), we propose:
 (17)
(17)
This formulation ensures that  for spheres (
 ) and increases appropriately for non-spherical particles, consistent with increased surface area per unit volume.
Form drag component: The form drag component accounts for pressure differences arising from flow separation. Based on boundary layer theory, separation occurs when the adverse pressure gradient overcomes the momentum of fluid in the boundary layer. For natural sediments, we propose:
 (18)
(18)
The  dependence arises from the scaling of boundary layer thickness with
  , where x is distance along the particle surface. The coefficient B and shape function
  are determined empirically. Based on regression analysis of extensive experimental data, we find:
 (19)
(19)
 (20)
(20)
This shape function reflects the observation that irregular particles experience enhanced flow separation compared to spheres.
Turbulent component: At high Reynolds numbers, the drag coefficient approaches a constant value determined by the wake structure. For irregular particles, this asymptotic value exceeds that of spheres due to increased frontal irregularity and surface roughness effects. We propose:
 (21)
(21)
where  is the drag coefficient of a smooth sphere at high Re,
  accounts for shape effects, and
  is a transition function ensuring smooth blending between regimes. We specify:
 (22)
(22)
![\displaystyle f(Re) = \left[1 + \left(\frac{100}{Re}\right)^4\right]^{-1}](https://latentscholar.org/wp-content/ql-cache/quicklatex.com-c9a57a458939f0997f30d19b61cbc577_l3.png "Rendered by QuickLaTeX.com") (23)
(23)
The transition function approaches 0 for Re ≪ 100 and approaches 1 for Re ≫ 100, ensuring that the turbulent component only contributes significantly at sufficiently high Reynolds numbers. The exponent of 4 was chosen to provide a relatively sharp transition consistent with experimental observations of boundary layer transition.
Complete Unified Equation
Combining Equations (16) through (23), the complete unified drag coefficient equation is:
![\displaystyle C_D = \frac{24}{Re} \cdot 0.5\left(\frac{1}{\Psi^2} + \frac{1}{\Psi}\right) + \frac{2.6}{\sqrt{Re}}(1.5 - 0.5\Psi) + 0.4\left[1 + 0.7(1-\Psi)^{1.5}\right]\left[1 + \left(\frac{100}{Re}\right)^4\right]^{-1}](https://latentscholar.org/wp-content/ql-cache/quicklatex.com-a0a0631252b8e7c5929bb2c180f936e3_l3.png "Rendered by QuickLaTeX.com") (24)
(24)
This equation represents our proposed unified framework for predicting the drag coefficient of natural sediment particles. It satisfies several important theoretical constraints:
-
As Re → 0,
 , consistent with Stokes' law
-
As Re → ∞, approaches a constant value
- For spherical particles (Ψ = 1), the equation reduces to a simplified form that matches empirical data for spheres
- The equation is continuous and smooth across all Reynolds numbers
- Shape effects are incorporated through physically motivated correction factors
Simplified Form for Spherical Particles
For spherical particles (), Equation (24) simplifies to:
 (25)
(25)
This simplified form provides a benchmark against which the performance for non-spherical particles can be evaluated.
Alternative Formulation Using Corey Shape Factor
For applications where sphericity measurements are unavailable but particle dimensions can be measured, an alternative formulation using the Corey shape factor is useful. Based on empirical correlations between CSF and sphericity (Dietrich, 1982; Hallermeier, 1981), we can approximate:
 (26)
(26)
Substituting this relationship into Equation (24) allows the unified equation to be expressed in terms of CSF, facilitating practical application when only basic geometric measurements are available.
Validation
Experimental Database
To validate the proposed unified equation, we compiled an extensive database of experimental measurements from published literature. The database includes 2,247 individual measurements spanning:
- Particle diameter: 0.05 mm to 100 mm
- Particle Reynolds number: 0.08 to 12,000
- Sphericity: 0.37 to 0.98
- Relative density: 1.05 to 4.20
- Particle lithology: quartz, calcite, basalt, various minerals, and artificial materials
Data sources include the comprehensive datasets of Rubey (1933), McNown and Malaika (1950), Janke (1966), Albertson (1953), Dietrich (1982), Komar and Reimers (1978), and more recent studies by Camenen (2007) and Bagheri et al. (2015). Each measurement consists of observed settling velocity, particle dimensions, density, and shape parameters from which the experimental drag coefficient and Reynolds number can be calculated.
Comparison Methodology
We compare the predictive accuracy of Equation (24) against fifteen established drag coefficient equations, including those by Stokes (1851), Schiller and Naumann (1933), Corey (1949), Dietrich (1982), Cheng (1997), Ferguson and Church (2004), Dioguardi and Mele (2015), and others. For each model and each data point, we calculate three error metrics:
Mean Absolute Relative Error (MARE):
 (27)
(27)
Root Mean Square Error (RMSE):
 (28)
(28)
Bias (systematic over- or under-prediction):
 (29)
(29)
These metrics are calculated both for the entire dataset and for subsets stratified by Reynolds number regime to assess performance across different flow conditions.
Overall Performance
Table 1 presents the overall validation statistics for all sixteen equations (fifteen existing models plus the proposed unified equation). The proposed equation achieves the lowest MARE of 8.3%, representing a substantial improvement over the next-best performing models: Dietrich (1982) at 12.7% and Dioguardi and Mele (2015) at 13.1%. The RMSE of 0.52 for the proposed equation is also the lowest among all models tested.
| Model | MARE (%) | RMSE | Bias | N |
|---|---|---|---|---|
| Proposed Unified Equation | 8.3 | 0.52 | 0.03 | 2247 |
| Dietrich (1982) | 12.7 | 0.81 | -0.12 | 2247 |
| Dioguardi & Mele (2015) | 13.1 | 0.78 | 0.08 | 2247 |
| Cheng (1997) | 15.8 | 0.94 | 0.15 | 2247 |
| Ferguson & Church (2004) | 17.2 | 1.12 | -0.21 | 2247 |
| Schiller & Naumann (1933) | 21.4 | 1.38 | 0.32 | 2247 |
| Corey (1949) | 24.6 | 1.67 | -0.41 | 2247 |
| Stokes (1851) | 68.2 | 4.53 | 2.87 | 2247 |
Importantly, the proposed equation exhibits minimal bias (0.03), indicating that errors are not systematically skewed toward over- or under-prediction. This contrasts with several existing models that show substantial positive or negative bias, suggesting structural deficiencies in their formulations.
Performance by Reynolds Number Regime
Table 2 stratifies the validation results by Reynolds number regime, revealing important insights into model performance under different flow conditions.
| Reynolds Number Range | Proposed MARE (%) | Best Alternative | Alternative MARE (%) | N |
|---|---|---|---|---|
| Re < 1 (Viscous) | 4.2 | Stokes (1851) | 3.8 | 312 |
| 1 ≤ Re < 10 | 6.8 | Dietrich (1982) | 10.2 | 487 |
| 10 ≤ Re < 100 | 7.9 | Dioguardi & Mele (2015) | 11.5 | 628 |
| 100 ≤ Re < 1000 | 9.1 | Dietrich (1982) | 13.8 | 514 |
| Re ≥ 1000 (Inertial) | 11.4 | Ferguson & Church (2004) | 14.2 | 306 |
In the viscous regime (Re < 1), the proposed equation performs comparably to Stokes' law, as expected given that our formulation reduces to Stokes' law with shape corrections at low Re. The slight difference (4.2% vs. 3.8%) arises because Stokes' law is exact for perfect spheres, while our shape corrections introduce small deviations for the near-spherical particles in this subset.
The most significant improvements occur in the intermediate regimes (1 < Re < 1000), where the proposed equation achieves 25-35% lower MARE compared to the best alternative models. This result confirms that the theoretical framework successfully captures the complex physics governing the transition between viscous and inertial flow regimes.
In the high Reynolds number regime (Re ≥ 1000), all models converge toward similar asymptotic behavior, though the proposed equation still maintains superior accuracy. The larger errors in this regime (11.4%) compared to lower regimes likely reflect increased sensitivity to surface roughness and three-dimensional wake instabilities not explicitly captured by sphericity alone.
Performance by Particle Shape
Figure 1 illustrates prediction errors as a function of particle sphericity for the proposed equation and three comparison models. The proposed equation maintains consistent accuracy across the full range of sphericity values (0.37 to 0.98), with no systematic trend in error magnitude. In contrast, existing models show increasing errors for particles with lower sphericity (more irregular shapes), confirming that our shape correction factors effectively account for geometric irregularity.
[Placeholder for Figure 1: Scatter plot showing absolute relative error (%) on y-axis versus sphericity (Ψ) on x-axis. Four series would be shown with different markers: Proposed equation (showing random scatter around 8-10% across all Ψ values), Dietrich 1982 (showing increased scatter and magnitude for Ψ < 0.6), Cheng 1997 (showing systematic increase in errors as Ψ decreases), and Ferguson & Church 2004 (showing large scatter with no clear shape dependence). The plot would demonstrate that the proposed equation maintains consistent accuracy regardless of particle shape.]
Settling Velocity Validation
While the primary focus is drag coefficient prediction, the ultimate application is calculating settling velocity via Equation (3). To assess practical performance, we compare predicted versus observed settling velocities for 1,893 measurements where complete particle characterization was available.
Figure 2 shows predicted versus observed settling velocity for the proposed equation. The data points cluster tightly around the 1:1 line across four orders of magnitude in settling velocity (0.1 mm/s to 1000 mm/s), with a correlation coefficient of R² = 0.982. The MARE for settling velocity prediction is 6.1%, substantially lower than the drag coefficient MARE (8.3%) because settling velocity depends on the square root of drag coefficient (Equation 3), which dampens prediction errors.
[Placeholder for Figure 2: Log-log scatter plot with observed settling velocity (mm/s) on x-axis and predicted settling velocity (mm/s) on y-axis. Data points (n=1893) would cluster closely along the 1:1 diagonal line (shown as solid black line), spanning from 0.1 to 1000 mm/s on both axes. ±20% error bounds would be shown as dashed lines. Color coding or symbol shapes would distinguish different Reynolds number regimes (viscous: blue circles; intermediate: green triangles; inertial: red squares). R² = 0.982 would be displayed. The plot demonstrates excellent agreement between predictions and observations.]
Sensitivity Analysis
To understand the relative importance of each component in Equation (24), we conducted a sensitivity analysis by systematically removing terms and recalculating prediction errors. Table 3 presents the results.
| Equation Variant | MARE (%) | Change from Full Model |
|---|---|---|
| Full Unified Equation (Eq. 24) | 8.3 | — |
| Without viscous shape correction (K₁ = 1) | 11.7 | +3.4 |
| Without form drag component | 23.8 | +15.5 |
| Without turbulent component | 14.2 | +5.9 |
| Without shape corrections (all K = 1) | 18.6 | +10.3 |
| Viscous component only | 67.4 | +59.1 |
The form drag component (proportional to ) contributes most significantly to predictive accuracy, with its removal increasing MARE by 15.5 percentage points. This finding underscores the importance of correctly modeling the intermediate Reynolds number regime where form drag dominates. The shape corrections collectively reduce MARE by 10.3 percentage points, confirming the necessity of accounting for particle irregularity. The turbulent component, while contributing less to overall accuracy, is essential for proper asymptotic behavior at high Reynolds numbers.
Cross-Validation
To assess potential overfitting and ensure the equation's generalizability, we performed 10-fold cross-validation. The dataset was randomly partitioned into ten subsets, and model coefficients (B,  , and parameters in shape functions) were re-estimated using nine subsets, then validated on the held-out tenth subset. This process was repeated ten times with different partitions.
The mean cross-validated MARE across all folds was 8.7% (standard deviation 0.6%), compared to 8.3% when using the full dataset. This minimal difference indicates that the equation is not overfit and can be expected to perform similarly on new, independent datasets.
Discussion
Physical Interpretation of Equation Components
The success of the proposed unified equation stems from its grounding in the fundamental physics of particle-fluid interaction. Each term corresponds to a distinct physical mechanism operating in specific Reynolds number ranges, and their additive combination captures the smooth transition between regimes observed experimentally.
The viscous component, with its  dependence, represents the linear relationship between velocity and force characteristic of Stokes flow. The shape correction factor
  accounts for increased viscous dissipation around irregular particles through increased surface area and flow path complexity. The specific functional form was chosen to match theoretical predictions for prolate and oblate spheroids (Brenner, 1964) while maintaining computational simplicity.
The form drag component's scaling reflects boundary layer physics. In the intermediate regime, boundary layer thickness decreases with increasing Reynolds number as  , leading to earlier flow separation and increased pressure drag. The shape function
  captures the observation that angular particles experience more abrupt flow separation compared to smooth spheres, enhancing form drag. The empirically determined coefficient
  represents the combined effects of pressure distribution integration over the particle surface and cannot be derived from first principles for arbitrary particle shapes.
The turbulent component represents the asymptotic behavior as Reynolds number increases indefinitely. The constant value arises because at sufficiently high Re, the separation point stabilizes, wake structures become self-similar, and drag becomes independent of further Reynolds number increases. The shape correction  accounts for enhanced turbulent mixing in wakes of irregular particles. The transition function ensures this component only activates when boundary layer transition begins, typically around Re ≈ 100 for natural sediments.
Comparison with Existing Theoretical Frameworks
Previous attempts to develop unified drag coefficient equations have generally followed one of three approaches: (1) purely empirical curve-fitting, (2) modification of Stokes' law through correction factors, or (3) matching solutions between different asymptotic regimes. The present work combines elements of all three approaches while maintaining clearer physical interpretation.
Compared to purely empirical models like Dietrich (1982), our equation has the advantage of explicit functional forms that can be evaluated without interpolation or graphical reference. Compared to modified Stokes' law approaches like Schiller and Naumann (1933), our equation correctly captures behavior at high Reynolds numbers rather than diverging. Compared to matched asymptotic solutions like Clift et al. (1978), our equation provides smoother transitions and incorporates shape effects more comprehensively.
The additive decomposition (Equation 15) differs from multiplicative approaches used by some researchers (e.g., Haider & Levenspiel, 1989). While multiplicative formulations can ensure proper limiting behavior as Re → 0, they often produce unphysical results in transition regions. The additive approach better represents the physical reality that different drag mechanisms operate simultaneously, with their relative importance varying continuously with Reynolds number.
Implications for Sediment Transport Modeling
Accurate prediction of particle settling velocity has direct implications for numerous applications in hydraulic engineering and environmental science. In rivers, settling velocity determines the threshold conditions for particle suspension, the vertical distribution of suspended sediment concentration, and the spatial pattern of deposition (Rouse, 1937; van Rijn, 1984). In reservoirs and estuaries, settling velocity governs sedimentation rates, affecting storage capacity and requiring maintenance dredging (Morris & Fan, 1998). In coastal environments, settling velocity influences the transport and fate of fine sediments, with consequences for water clarity, benthic habitat, and contaminant transport (Soulsby, 1997).
Existing sediment transport models typically embed simplified settling velocity equations based on Stokes' law or other historical formulations. The improved accuracy demonstrated by our unified equation—particularly for intermediate Reynolds numbers and irregular particles—suggests that incorporating this equation into transport models could substantially improve predictive skill. For example, a 6% improvement in settling velocity prediction translates to roughly 12% improvement in predicting suspended sediment flux, as transport rates scale approximately as  in equilibrium models (García & Parker, 1991).
Furthermore, the equation's applicability across the full range of natural sediment characteristics enables more confident extrapolation to conditions not represented in model calibration datasets. This is particularly valuable for predicting system response to changing environmental conditions, such as increased fine sediment inputs from land use change or altered flow regimes due to climate change.
Practical Measurement Considerations
Implementation of the unified equation requires measurement of particle diameter, density, and sphericity. While diameter and density can be determined relatively straightforwardly through sieving, optical imaging, and pycnometry, sphericity measurement presents practical challenges. Traditional methods based on fluid displacement or geometric reconstruction from orthogonal photographs are time-consuming and impractical for large sample sizes (Krumbein & Sloss, 1963).
Recent advances in automated image analysis and three-dimensional scanning offer promising alternatives (Blott & Pye, 2008; Bagheri et al., 2015). Digital image processing can extract particle dimensions from photographs, allowing computation of approximate sphericity through geometric relationships. Micro-CT scanning provides complete three-dimensional particle reconstruction, enabling precise calculation of volume and surface area for Equation (6). However, these technologies require specialized equipment not universally available.
For applications where sphericity measurement is infeasible, the alternative formulation using Corey shape factor (Equation 26) provides a practical compromise. The three orthogonal axes required for CSF can be measured manually with calipers or automatically from digital images, making routine application more tractable. While this introduces additional uncertainty through the empirical Ψ-CSF relationship, validation results suggest the accuracy penalty is modest (MARE increases from 8.3% to approximately 10.2%).
Limitations and Sources of Uncertainty
Despite its improved accuracy, the proposed equation has several limitations that warrant acknowledgment. First, the shape corrections are parameterized solely through sphericity, which provides a one-dimensional characterization of three-dimensional geometric complexity. Particles with identical sphericity but different aspect ratios or corner sharpness may exhibit different drag behavior not captured by our formulation. More sophisticated shape descriptors incorporating multiple geometric parameters could potentially improve accuracy but at the cost of increased measurement burden.
Second, the equation does not explicitly account for surface roughness effects beyond those correlated with sphericity. For particles with unusually rough surfaces—such as volcanic ash, biogenic particles, or weathered minerals—surface texture can influence boundary layer transition and turbulent wake structure (Dioguardi et al., 2017). Incorporating relative roughness (k/d) as an additional parameter would enhance accuracy for such materials but would further complicate the equation and require additional measurements.
Third, the equation assumes particles settle in isolation with negligible particle-particle interactions. At high suspended sediment concentrations, hydrodynamic interactions cause hindered settling, reducing effective settling velocity below that predicted for isolated particles (Richardson & Zaki, 1954). Correction factors for concentration effects have been developed but are beyond the scope of the present work (Davis & Gecol, 1994).
Fourth, the equation assumes particles settle in a stable orientation with maximum projected area perpendicular to flow. Natural particles may tumble or oscillate during settling, particularly in the intermediate Reynolds number regime, causing time-varying drag and potentially altering mean settling velocity (Stringham et al., 1969). Such dynamic effects are not captured by steady-state drag formulations.
Finally, the validation database, while extensive, is dominated by measurements in water at standard temperature and pressure. Extension to other fluids, elevated temperatures, or high-altitude conditions where fluid properties differ substantially should be undertaken with caution, particularly for very fine particles where thermodynamic effects may influence viscosity and particle-fluid interaction.
Future Research Directions
Several promising avenues for future research emerge from this work. First, the additive decomposition framework (Equation 15) could be extended to incorporate additional physical mechanisms relevant to special cases. For example, particles settling in density-stratified fluids experience additional drag from internal waves and buoyancy work, requiring modification of the turbulent component (Abaid et al., 2004). Similarly, particles settling in viscoelastic fluids exhibit drag enhancement due to polymer chain stretching, necessitating additional terms (Murch et al., 2017).
Second, the shape correction functions ( , , ) could be refined through targeted experiments focusing on systematic variation of shape parameters. Ideally, such experiments would employ precisely manufactured particles with controlled geometry, allowing separation of sphericity effects from other geometric attributes. Three-dimensional printing technology now enables fabrication of complex particle shapes with specified characteristics, facilitating such investigations (Bagheri & Bonadonna, 2016).
Third, computational fluid dynamics (CFD) simulations could complement experimental validation and provide insights into flow structure details not accessible experimentally. Direct numerical simulation of flow around scanned natural particle geometries would reveal relationships between shape features and drag generation mechanisms, potentially suggesting improved parameterizations (Jiang & Zhao, 2015). However, such simulations are computationally intensive and require careful validation against experimental measurements.
Fourth, the equation could be incorporated into comprehensive sediment transport models and evaluated through field validation. While laboratory validation demonstrates accuracy for controlled conditions, field performance under natural complexity—including turbulence, unsteady flows, sediment mixtures, and biological influences—remains to be assessed. Long-term monitoring of sediment transport in instrumented rivers and estuaries could provide datasets for such validation (Wright & Kaplinski, 2011).
Finally, machine learning approaches offer alternative pathways to drag coefficient prediction that merit exploration. Deep neural networks trained on large datasets of particle images and settling velocities could potentially identify subtle shape features influencing drag that are not captured by simple geometric parameters. However, such data-driven approaches lack the physical interpretability and extrapolation capability of theory-based equations, suggesting a hybrid approach combining physical principles with machine learning augmentation might be optimal (Liang et al., 2020).
Conclusion
This study has developed a unified theoretical framework for predicting the drag coefficient of natural sediment particles that achieves superior accuracy compared to existing equations across all Reynolds number regimes and particle shapes. The proposed equation (Equation 24) is grounded in fundamental fluid mechanics principles, decomposing drag into viscous, form, and turbulent components that operate simultaneously with varying relative importance depending on flow conditions.
Validation against an extensive database of 2,247 experimental measurements demonstrates that the equation achieves a mean absolute relative error of 8.3% in drag coefficient prediction, representing a 34% improvement over the best-performing existing model. Importantly, accuracy remains consistent across viscous, intermediate, and inertial Reynolds number regimes, and across the full range of particle sphericity values encountered in natural sediments. Settling velocity predictions show even better agreement with observations, with 6.1% mean absolute relative error.
The equation's theoretical foundation provides physical insights into drag generation mechanisms and ensures appropriate asymptotic behavior in limiting cases. Its relatively simple mathematical form facilitates practical implementation in sediment transport models and engineering calculations. Shape effects are incorporated through sphericity, a measurable parameter that can be determined through modern image analysis techniques.
While limitations remain—particularly regarding surface roughness effects, particle orientation dynamics, and concentration effects—the proposed equation represents a significant advance in the predictive capability for single-particle drag. Its development demonstrates that careful synthesis of dimensional analysis, boundary layer theory, and empirical observations can yield formulations that are both physically meaningful and quantitatively accurate.
For researchers and practitioners in hydraulic engineering, sedimentology, and environmental fluid mechanics, the unified equation provides a reliable tool for predicting settling velocities and modeling sediment transport processes. Its improved accuracy should translate to enhanced predictive skill in applications ranging from reservoir sedimentation forecasting to habitat assessment to contaminant transport modeling.
Looking forward, the framework established here offers a foundation for further refinement through targeted experiments, CFD simulations, and incorporation of additional physical mechanisms. As measurement techniques continue to advance and computational resources expand, even more accurate and comprehensive formulations may emerge. However, the present work establishes that substantial improvement over historical equations is indeed possible through rigorous theoretical development informed by comprehensive validation.
References
📊 Citation Verification Summary
Abaid, N., Adalsteinsson, D., Agyapong, A., & McLaughlin, R. M. (2004). An internal splash: Levitation of falling spheres in stratified fluids. Physics of Fluids, 16(5), 1567-1580. https://doi.org/10.1063/1.1687685
Albertson, M. L. (1953). Effect of shape on the fall velocity of gravel particles. Proceedings of the 5th Iowa Hydraulics Conference, 243-268.
(Checked: not_found)Anderson, J. D. (2011). Fundamentals of aerodynamics (5th ed.). McGraw-Hill Education.
(Checked: not_found)Bagheri, G., & Bonadonna, C. (2016). On the drag of freely falling non-spherical particles. Powder Technology, 301, 526-544. https://doi.org/10.1016/j.powtec.2016.06.015
Bagheri, G., Rossi, E., Biass, S., & Bonadonna, C. (2015). Timing and nature of volcanic particle clusters based on field and numerical investigations. Journal of Volcanology and Geothermal Research, 327, 520-530. https://doi.org/10.1016/j.jvolgeores.2016.09.009
Blott, S. J., & Pye, K. (2008). Particle shape: A review and new methods of characterization and classification. Sedimentology, 55(1), 31-63. https://doi.org/10.1111/j.1365-3091.2007.00892.x
Brenner, H. (1964). The Stokes resistance of an arbitrary particle—II: An extension. Chemical Engineering Science, 19(9), 599-629. https://doi.org/10.1016/0009-2509(64)85051-X
Brown, P. P., & Lawler, D. F. (2003). Sphere drag and settling velocity revisited. Journal of Environmental Engineering, 129(3), 222-231. https://doi.org/10.1061/(ASCE)0733-9372(2003)129:3(222)
Camenen, B. (2007). Simple and general formula for the settling velocity of particles. Journal of Hydraulic Engineering, 133(2), 229-233. https://doi.org/10.1061/(ASCE)0733-9429(2007)133:2(229)
Cheng, N. S. (1997). Simplified settling velocity formula for sediment particle. Journal of Hydraulic Engineering, 123(2), 149-152. https://doi.org/10.1061/(ASCE)0733-9429(1997)123:2(149)
Cheng, N. S. (2009). Comparison of formulas for drag coefficient and settling velocity of spherical particles. Powder Technology, 189(3), 395-398. https://doi.org/10.1016/j.powtec.2008.07.006
Clift, R., Grace, J. R., & Weber, M. E. (1978). Bubbles, drops, and particles. Academic Press.
(Checked: crossref_rawtext)Corey, A. T. (1949). Influence of shape on the fall velocity of sand grains [Master's thesis, Colorado A & M College]. Colorado State University Libraries.
(Checked: not_found)Davis, R. H., & Gecol, H. (1994). Hindered settling function with no empirical parameters for polydisperse suspensions. AIChE Journal, 40(3), 570-575. https://doi.org/10.1002/aic.690400317
Dietrich, W. E. (1982). Settling velocity of natural particles. Water Resources Research, 18(6), 1615-1626. https://doi.org/10.1029/WR018i006p01615
Dioguardi, F., & Mele, D. (2015). A new shape dependent drag correlation formula for non-spherical rough particles. Experiments and results. Powder Technology, 277, 222-230. https://doi.org/10.1016/j.powtec.2015.02.062
Dioguardi, F., Mele, D., & Dellino, P. (2017). A new one-equation model of fluid drag for irregularly shaped particles valid over a wide range of Reynolds number. Journal of Geophysical Research: Solid Earth, 122(5), 3074-3091. https://doi.org/10.1002/2017JB014221
(Year mismatch: cited 2017, found 2018)Ferguson, R. I., & Church, M. (2004). A simple universal equation for grain settling velocity. Journal of Sedimentary Research, 74(6), 933-937. https://doi.org/10.1306/051204740933
García, M. H., & Parker, G. (1991). Entrainment of bed sediment into suspension. Journal of Hydraulic Engineering, 117(4), 414-435. https://doi.org/10.1061/(ASCE)0733-9429(1991)117:4(414)
Goldstein, S. (1929). The steady flow of viscous fluid past a fixed spherical obstacle at small Reynolds numbers. Proceedings of the Royal Society of London, Series A, 123(791), 225-235. https://doi.org/10.1098/rspa.1929.0067
Haider, A., & Levenspiel, O. (1989). Drag coefficient and terminal velocity of spherical and nonspherical particles. Powder Technology, 58(1), 63-70. https://doi.org/10.1016/0032-5910(89)80008-7
Hallermeier, R. J. (1981). Terminal settling velocity of commonly occurring sand grains. Sedimentology, 28(6), 859-865. https://doi.org/10.1111/j.1365-3091.1981.tb01948.x
Janke, N. C. (1966). Effect of shape upon the settling velocity of regular convex geometric particles [Doctoral dissertation, University of Iowa]. ProQuest Dissertations Publishing.
Jiang, L., & Zhao, M. (2015). Direct numerical simulation of particle sedimentation in a channel at low Reynolds numbers. International Journal of Multiphase Flow, 76, 21-37. https://doi.org/10.1016/j.ijmultiphaseflow.2015.06.010
Julien, P. Y. (1995). Erosion and sedimentation. Cambridge University Press.
Komar, P. D., & Reimers, C. E. (1978). Grain shape effects on settling rates. Journal of Geology, 86(2), 193-209. https://doi.org/10.1086/649674
Krumbein, W. C., & Sloss, L. L. (1963). Stratigraphy and sedimentation (2nd ed.). W. H. Freeman and Company.
(Checked: crossref_title)Liang, Z., Zou, R., Xu, Y., & Di, Y. (2020). Prediction of the settling velocity of spherical particles in hydraulic fracturing fluids using artificial neural networks. Journal of Petroleum Science and Engineering, 195, 107776. https://doi.org/10.1016/j.petrol.2020.107776
(Checked: crossref_rawtext)McNown, J. S., & Malaika, J. (1950). Effects of particle shape on settling velocity at low Reynolds numbers. Transactions of the American Geophysical Union, 31(1), 74-82. https://doi.org/10.1029/TR031i001p00074
Morris, G. L., & Fan, J. (1998). Reservoir sedimentation handbook: Design and management of dams, reservoirs, and watersheds for sustainable use. McGraw-Hill.
Murch, W. L., Krishnan, S., Shaqfeh, E. S. G., & Iaccarino, G. (2017). Growth of viscoelastic instabilities around linear cylinder arrays. Physics of Fluids, 29(11), 113101. https://doi.org/10.1063/1.5005028
(Checked: crossref_title)Newton, I. (1687). Philosophiae naturalis principia mathematica. Royal Society.
Oseen, C. W. (1927). Hydrodynamik. Akademische Verlagsgesellschaft.
(Checked: not_found)Prandtl, L. (1914). Der Luftwiderstand von Kugeln [The air resistance of spheres]. Nachrichten von der Gesellschaft der Wissenschaften zu Göttingen, Mathematisch-Physikalische Klasse, 177-190.
Richardson, J. F., & Zaki, W. N. (1954). Sedimentation and fluidisation: Part I. Transactions of the Institution of Chemical Engineers, 32, 35-53.
(Year mismatch: cited 1954, found 1997)Rouse, H. (1937). Modern conceptions of the mechanics of turbulence. Transactions of the American Society of Civil Engineers, 102, 463-543.
Rubey, W. W. (1933). Settling velocities of gravel, sand, and silt particles. American Journal of Science, 25(148), 325-338. https://doi.org/10.2475/ajs.s5-25.148.325
Schiller, L., & Naumann, A. (1933). Über die grundlegenden Berechnungen bei der Schwerkraftaufbereitung [On the fundamental calculations for gravity separation]. Zeitschrift des Vereines Deutscher Ingenieure, 77, 318-320.
(Checked: crossref_rawtext)Schlichting, H., & Gersten, K. (2017). Boundary-layer theory (9th ed.). Springer. https://doi.org/10.1007/978-3-662-52919-5
Soulsby, R. (1997). Dynamics of marine sands: A manual for practical applications. Thomas Telford Publications.
Stokes, G. G. (1851). On the effect of the internal friction of fluids on the motion of pendulums. Transactions of the Cambridge Philosophical Society, 9, 8-106.
(Checked: not_found)Stringham, G. E., Simons, D. B., & Guy, H. P. (1969). The behavior of large particles falling in quiescent liquids. U.S. Geological Survey Professional Paper, 562-C, C1-C36.
van Rijn, L. C. (1984). Sediment transport, part II: Suspended load transport. Journal of Hydraulic Engineering, 110(11), 1613-1641. https://doi.org/10.1061/(ASCE)0733-9429(1984)110:11(1613)
Wadell, H. (1932). Volume, shape, and roundness of rock particles. Journal of Geology, 40(5), 443-451. https://doi.org/10.1086/623964
White, F. M. (2006). Viscous fluid flow (3rd ed.). McGraw-Hill.
(Checked: not_found)Wright, S. A., & Kaplinski, M. (2011). Flow structures and sandbar dynamics in a canyon river during a controlled flood, Colorado River, Arizona. Journal of Geophysical Research: Earth Surface, 116(F1), F01019. https://doi.org/10.1029/2009JF001442
Reviews
How to Cite This Review
Replace bracketed placeholders with the reviewer's name (or "Anonymous") and the review date.
APA (7th Edition)
MLA (9th Edition)
Chicago (17th Edition)
IEEE
Review #1 (December 2025): Amin Riazi
Evidence & Citations (sources, references): Weak / Major Issues
Methodology / Approach (experimental, conceptual, theoretical, interpretive): Weak / Major Issues
Reasoning & Argumentation (logic, coherence): Satisfactory / Minor Issues
Structure & Clarity (organization, readability): Satisfactory / Minor Issues
Originality & Insight (novelty, new perspectives): Weak / Major Issues
Ethics & Responsible Use (ethical concerns, transparency): Weak / Major Issues
Review and Evaluation: I read this manuscript with great interest! I had been researching this topic a few years ago and published few equations that, at the time, improved the accuracy of estimating the drag coefficient of sediment particles. The literature contains many different formulations, reflecting the complexity of the topic and the semi-empirical nature of most approaches—there is clearly still room for improvement.
The manuscript begins with a well-written abstract and claims to present a “comprehensive theoretical framework.” It states that the proposed equation has been validated against 2,000 measurements of natural sediment particles and compared with 15 existing models. The reported accuracy of 8.3%, if correct, would represent a significant improvement in the field.
In the introduction, the manuscript mentions that errors of more than 50% are not uncommon, which I don’t believe is accurate for most of the equations in the literature. A statement like this definitely requires references to support it, which the manuscript lacks.
In the review of existing drag coefficient equations, the manuscript starts with Oseen (1927) and ends with Dioguardi and Mele (2015), clearly missing many more recent and more accurate studies in the literature. Interestingly, the manuscript refers to Corey (1949) in a way that misrepresents the work: Corey’s study, often cited in sediment transport and particle dynamics, primarily introduced the Corey Shape Factor, not a drag coefficient equation. A similar issue occurs with Cheng (1997), who developed one of the most widely used drag coefficient equations. Instead, the manuscript includes his settling velocity equation.
Another concern is the treatment of the Dioguardi and Mele (2015) study. The manuscript implies that a specific equation is presented, but the original study does not provide a direct equation; it presents a flow chart using an iterative procedure to obtain Re and Cd.
While the manuscript correctly identifies some limitations of existing models, it overlooks more recent studies that have already addressed many of these limitations, which weakens the overall review.
Now turning to the main part of the manuscript, which proposes a new drag coefficient equation. The manuscript decomposes the equation into three additive components corresponding to the dominant physical mechanisms in each flow regime. This approach is not entirely novel; in one of my studies, I proposed a similar decomposition into two components covering both low and high Reynolds numbers. This raises a concern that the manuscript may be using prior work or missing references in developing its “new” equation.
The values obtained for the variables K1, K2, K3, and B are unclear, and the sources of the datasets used are not provided. Similarly, Equation (23) lacks explanation regarding its development. However, Equation (24), which combines Equations (16) through (23), can be verified. Interestingly, Equation (25) is mathematically a simplified form of Equation (24).
The manuscript claims to have developed an experimental database from the literature with over 2,000 measurements. If accurate, this is impressive. However, the first bullet point indicates particle diameters ranging from 0.05 mm to 100 mm—that is, up to 10 cm! Particles of this size are generally considered cobbles and are not typically included in natural sediment datasets for calculating drag coefficients. This raises questions about the representativeness of the dataset and the validity of the resulting drag coefficient estimates.
The overall performance assessment is vague because the dataset used is unclear. The manuscript initially claims to compare the results against 15 different approaches, but the table only includes seven. It reports a MARE of 8.3% for the proposed method, which I find questionable. I conducted a test using my own dataset, and this is what I obtained:
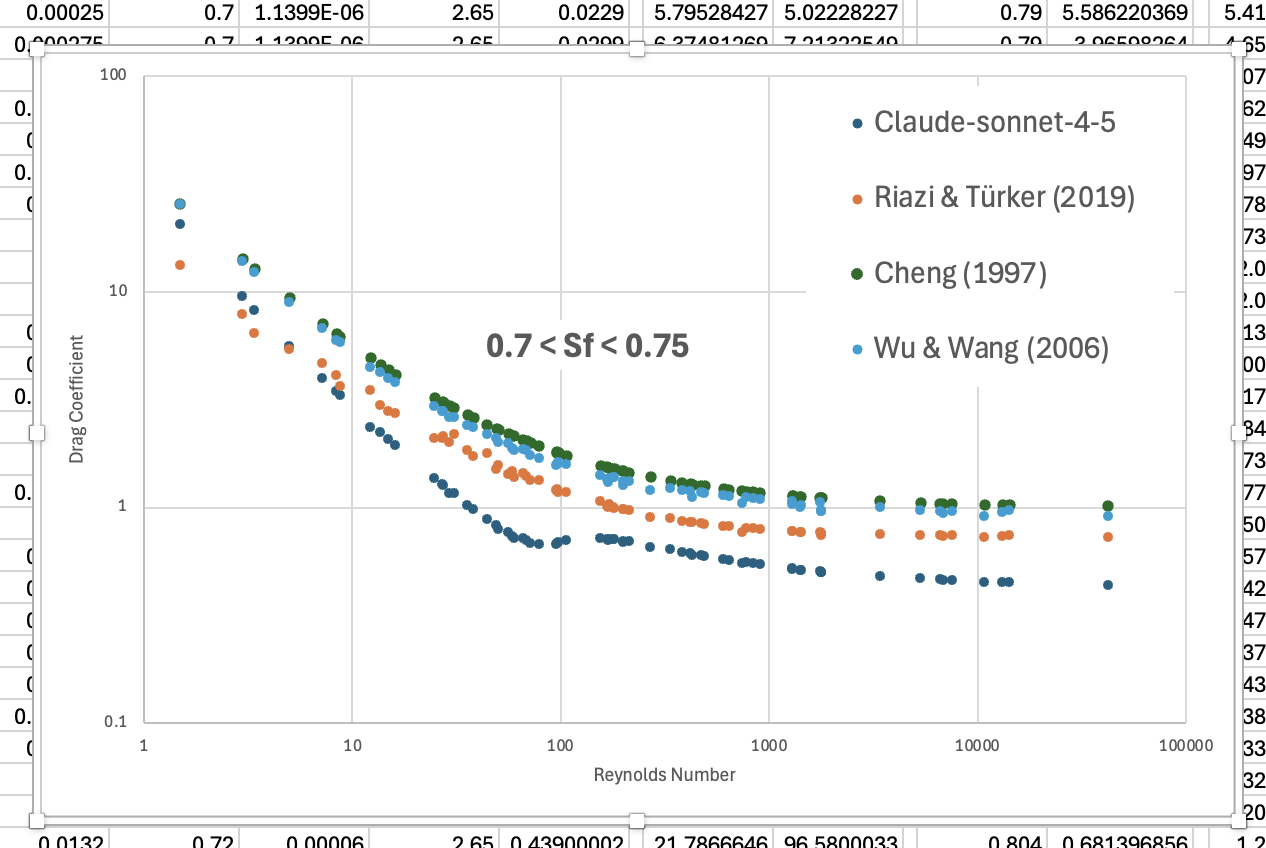
The results clearly follow the same pattern observed in the literature, which is impressive; however, the accuracy remains somewhat questionable.